本文分为两部分,第一部分是技术分析,第二部分是行为金融学指数及应用。出于忠于原文的考虑,本文保留了讲授中的英文部分,重要概念已用中文标示,有兴趣了解更多的可自行查阅相关资料。
• 以预测市场价格变化的未来趋势为目的,以图表为主要手段对市场行为进行的研究
• 市场行为:价格,交易量,持仓量
• 多数分析者将综合分析这三部分资料。
• 从行为金融理论发掘技术分析有效的原因
• Disposition effect(处置效应)
The tendency of investors to hold on to losing investments. Behavioral investors seem reluctant to realize losses. This disposition effect can lead to momentum in stock prices even if fundamental values follow a random walk. The fact that the demand of “disposition investors” for a company’s shares depends on the price history of those shares means that prices could close in on fundamental values only over time, consistent with the central motivation of technical analysis.
• Conservatism bias(保守性偏差)
A conservatism bias means that investors are too slow (too conservative) in updating their beliefs in response to new evidence. This means that they might initially underreact to news about a firm, so that prices will fully reflect new information only gradually. Such a bias would give rise to momentum in stock market returns.
• Representativeness bias(代表性偏差)
The notion of representativeness bias holds that people commonly do not take into account the size of a sample, acting as if a small sample is just as representative of a population as a large one. They may therefore infer a pattern too quickly based on a small sample and extrapolate apparent trends too far into the future.
• Overconfidence(过度自信)
A systematic tendency to overestimate one’s abilities. As traders become overconfident, they may trade more, inducing an association between trading volume and market returns. Technical analysis thus uses volume data as well as price history to direct trading strategy.
(1)市场行为包容消化一切
这是构成技术分析的基础。除非完全理解和接受这个前提条件,否则以下讨论毫无意义。
技术分析者认为,能够影响商品期货价格的任何因素——基础的、**的、心理的或任何其他方面的——实际都反映在价格之中。其实质含义是价格变化必定反映供求关系。技术分析者是通过价格间接研究经济基础。因为图表本身不能导致市场升跌,只是简明地显示了市场上流行的乐观或悲观心态。在价格趋势形成的早期或者市场正处在关键转折点的时候,往往没人确切了解市场为什么如此古怪地动作。至关紧要的时刻,技术分析者常常独辟蹊径,一语中的。
图表分析师只是通过研究价格图表及大量辅助技术指标,让市场自己揭示它最可能的走势,而非分析师凭他的精明“征服”了市场。知道股票涨落肯定有缘故,但他们认为这些原因对于分析预测无关痛痒。
(2)价格以趋势方式演变
这是技术分析的核心。研究图表的全部意义,就是要在一个趋势发生的早期,及时准确地将它揭示出来,从而达到顺趋势交易的目的。技术分析绝大部分理论本质上就是顺应趋势,即以判定和追随既成趋势为目的。
• 惯性定律 “墙倒众人推,破鼓万人锤”
• 中心思想:在趋势显露时加入,出现反向征兆时离开
(3)历史会重演
技术分析和市场行为学与人类心理学有着千丝万缕的联系。价格形态通过一些特定的价格图表形状表现出来,而这些图表表示了人们对某市场看好或看淡的心理。它们过去很管用,不妨认为在将来也同样有效,因为它们是以人类心理为依据的,而人类心理从来是“江山易改本性难移”。所以,打开未来之门的钥匙隐藏在历史里。
(1)适用于任何交易媒介
技术分析可以研究股票,商品,利率,GDP,没有用不上的地方。而经济基础方面的资料过于繁杂,大多数基础分析师只能专门研究某种或某类商品。市场有时平平淡淡,有时波澜壮阔;有时趋势明朗,有时杂乱无章。技术派可以集中精力和资源,专门对付趋势良好的市场,暂且不理会趋势不明者。而基础分析多是“专家”,常常无法享受这份灵活性。
(2)适用于任何时间尺度
“无论研究一天之内价格变化做高频的当日交易,还是顺应趋势做中等期限的跟势交易,都可以采用相同的原理。目前较长期预测技术往往被忽视。有人说图表分析只适合短时间,这是无稽之谈。也有人和稀泥,说基础分析适合做长期预测,而技术分析用于短线的时机选择更好。实践证明,使用周线图或月线图解决长期预报问题也毫不逊色。只要您完全领会了本书所讨论的技术原理,就能在各种交易工具中、各种时间尺度上左右逢源。”
(3)“既见树木又见森林”
同时跟踪所有市场,对商品市场总体上有很好的把握,避免从一而终导致的管窥蠡测,坐井观天。许多金融产品(期权、期货、股票、债券、利率)之间存在着内在的联系,可能产生相关联的反映,因此在价格变化上可以互为线索,相互参照。
第二部分:
Introduction: Behavioral Finance Indices and Application
(行为金融学指数及其应用)
1.1 Basic Psychological Factors Revisited(基本心理因素回顾)
Information Processing(信息处理)
• Forecasting Errors.
(Kahneman&Tversky,1972-73)
• Overconfidence.
(Barber & Odean, 2000-01)
• Conservatism.
• Sample Size Neglect and Representativeness.
Behavioral Biases(行为偏差)
• Framing(框定).
• Mental Accounting(心理账户).
(Statman, 1997)
• Regret Avoidance(逃避后悔).
(De Bondt and Thaler, 1987)
• Prospect Theory(期望理论).
• Affect.
(Statman, Fisher and Anginer, 2008)
Limits to Arbitrage(有限套利)
• Fundamental Risk(基本风险).
• Implementation Costs(实施成本).
• Model Risk(模型风险).
1.2 Indices Derived from Theories Developed(理论发展衍生的指数)
Trends and Corrections(趋势与修正)
Much of technical analysis seeks to uncover trends in market prices. This is in effect a search for momentum. Momentum can be absolute, in which case one searches for upward price trends, or relative, in which case the analyst looks to invest in one sector over another (or even take on a long-short position in the two sectors). Relative strength statistics are designed to uncover these potential opportunities.
Dow Theory(道氏理论)
It concludes that the market has three movements, denoted as ”main movement”, ”medium swing” and ”short swing” respectively. They are divided mainly due to the lengths of time intervals and can get seemingly contradicted simultaneously. More information can be discovered by the audience if interested. Elliott Wave Theory and Kondratieff Waves are introduced with the basic thoughts carried out by Mr. Dow.
Moving Average(移动平均)
• The moving average of a stock price is the average price over a given interval, where that interval is updated as time passes.
• MovingAverage =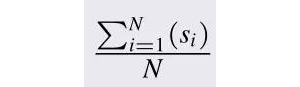
• Time elapses. The new moving average is calculated by simply changing the numerator.
• MovingAverage’=
• What can be inferred from a growing moving average? Do the math.
After a period in which prices have been falling, the moving average will be above the current price (because the moving average continues to average in the older and higher prices until they leave the sample period). In contrast, when prices have been rising, the moving average will be below the current price.
Prices breaking through the moving average from below is taken as a bullish signal, because it signifies a shift from a falling trend (with prices below the moving average) to a rising trend (with prices above the moving average). Conversely, when prices drop below the moving average, analysts might conclude that market momentum has become negative.
Other Common Indices(其他指数)
Breadth(涨跌幅度)
The breadth of the market is a measure of the extent to which movement in a market index is reflected widely in the price movements of all the stocks in the market. Simple method of measurement can be a substraction of the number of stocks declined in price from that of advanced. It can also be used to derive cumulative breadth data and moving average of cumulative breadth.
Relative Strength(相对强度)
Relative strength measures the extent to which a security has outperformed or underperformed either the market as a whole or its particular industry. Relative strength is computed by calculatingthe ratio of the price of the security to a price index for the industry.
For example, the relative strength of Toyota versus the auto industry would be measured by movements in the ratio of the price of Toyota divided by the level of an auto industry index. A rising ratio implies Toyota has been outperforming the rest of the industry. If relative strength can be assumed to persist over time, then this would be a signal to buy Toyota.
Similarly, the strength of an industry relative to the whole market can be computed by tracking the ratio of the industry price index to the market price index.
Sentiment Indicators(情绪指标)
Behavioral finance devotes considerable attention to market sentiment, which may be interpreted as the general level of optimism among investors.
以下是一些常见的情绪指标:
Trin Statistic(“Trin”统计量)
Trin ≡ 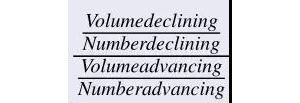
Above 1.0 are considered bearish because the falling stocks would then have higher average volume than the advancing stocks, indicating net selling pressure. For every buyer, there must be a seller of stock. Rising volume in a rising market should not necessarily indicate a larger imbalance of buyers versus sellers.
Confidence Index(信心指数)
The confidence index is the ratio of the average yield on 10 top-rated corporate bonds divided by the average yield on 10 intermediate-grade corporate bonds. The ratio shall be less than a hundred percent and positively correlated with the confidence in the market by the participants as a group.
Put/Call Ratio(卖出/买入比率)
The ratio of outstanding put options to outstanding call options is called the put/call ratio. Typically, the put/call ratio hovers around 65%. Interestingly though, different people have rather different forms of interpretation with respect to the trend of this index.[Especially considering contrarian investors]
Because put options do well in falling markets while call options do well in rising markets, deviations of the ratio from historical norms are considered to be a signal of market sentiment and therefore predictive of market movements.
However, a change in the ratio can be given a bullish or a bearish inter-pretation. Many technicians see an increase in the ratio as bearish, as it indicates growing interest in put options as a hedge against market declines. Thus, a rising ratio is taken as a sign of broad investor pessimism and a coming market decline.
Contrarian investors, however, believe that a good time to buy is when the rest of the market is bearish because stock prices are then unduly depressed. Therefore, they would take an increase in the put/ call ratio as a signal of a buy opportunity.
1.3Warning:Don’t be overoptimistic(警告:不要过度乐观)
Hindsight Bias(后见之明偏误)
A problem related to the tendency to perceive patterns where they don’t exist is data mining. After the fact, you can always find patterns and trading rules that would have generated enormous profits. If you test enough rules, some will have worked in the past. Unfortunately, picking a theory that would have worked after the fact carries no guarantee of future success.