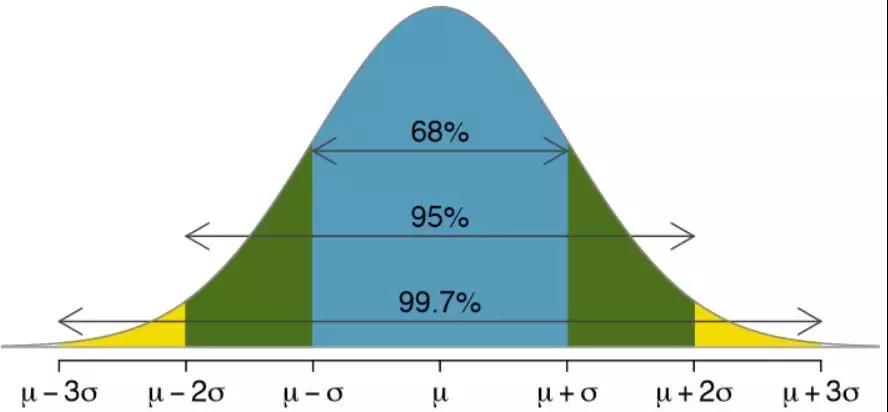
In any analysis related to the share prices , the basic assumption is that the prices follow Gaussian Normal Distribution in which the time series of prices are observed to form a bell shaped curve. In this normal distribution curve, the share prices of 68 percent of the samples are assumed to vary within one standard deviation from the average of the values.
However in most cases of share price movements, this assumption does not hold true.The shares are therefore observed to follow other related probability distribution functions. Hence, an indicator was made necessary to transform such prices into Gaussian normal distribution and thereby simplify identifying the trend reversals from share prices.
One such highly popular indicator is the Fisher Transform indicator, which is used to transform share prices following any probability distribution function into Gaussian normal distribution and thereby helps in identifying trend reversals.
The Fisher transform formula is used to convert stock prices, derivative prices, foreign exchange rates as well as technical indicators and is based on the assumption that the underlying prices would follow square wave distribution. The time series, thus transformed using the Fisher Transform formula would have very sharp turning points which prove highly simple and easier to identify bullish or bearish trends to the investors.
The density of price movements were observed to be highly concentrated at the left and right ends of the figure rather than around the center portion as is common with normal distribution. Further the histogram drawn using these prices showed that there was high level of occurrences in the first and last few bars, than at the middle points. This was in line with the sine distribution of the prices.
As the Treasury bill rates did not follow Gaussian Distribution Function, JF Ehlers then moved on to derive the formula for transforming these prices into normal distribution function which was popularly known as the Fisher Transform. The formula is explained as follows:
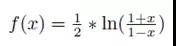
The Fisher transform could be used to transform time series data in any form of probability distribution into a Gaussian Normal Distribution function. In order to use this Fisher Transformation, the input data related to the prices of shares, Exchange Traded Funds, Foreign exchange rates or the technical indicators should first be constrained to remain within the limits of -1 to +1. Once this limitation is applied to the input data, it could then be transformed using the Fisher Transformation equation which would result in the following transformed distribution.
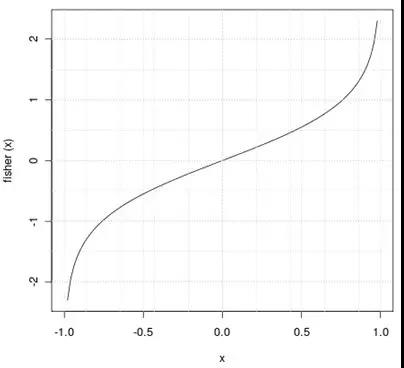
As could be observed from the above figure , when the input data of prices is near the average value ranging from -0.5 to +0.5, the transformed values are concentrated near unity. fisher (X) varies in the range of -1 to +1. On the other hand, when the input data is near its extreme values, the output from the Fisher Transformation is observed to be greatly magnified at the extremes. This is highly similar with the Gaussian normal distribution function, where most of the values are highly concentrated around the mean, while the extremes are observed to be concentrated at the right and left tails of the bell shaped curve.
Now this information obtained from the data of Fisher Transformation could be effectively applied to extract information for determining the trading strategies for investors. As explained above, the extreme values in share prices or other input data related to prices of futures and options, foreign exchange rates or technical indicators would result in highly amplified output data in the Fisher Transformation.
Thus, whenever the deep and sharp turning points are observed in the Fisher curve, investors could be clear that the rare events of peaks or bottoms have been reached by the share prices and could thereby determine their buying and selling decisions.
The Fisher Transformation function could thus be effectively used to identify major turning points in the prices.